


Delicious skittle statistics
- Mrs Desmond
- Feb 22, 2017
- 1 min read

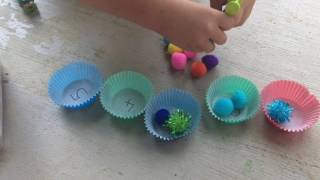
Kids love lollies! They love to sort them into colours, count and eat them. Skittle statistics is an activity which can be done with a broad range of kids as a way to engage them in statistical literacy.
First up you will need
- a bag of skittles (I gave each child a zip lock bag of 40)
- a piece of paper (I had the questions to find and a template of a graph drawn on grid paper as seen in the image)
- a pencil to write down answers
Method:
Step 1: Students sort out skittles into groups

Step 2: Students count the number of each coloured skittle
Step 3: Students fill out how many of each colour there are and how many altogether.
Step 4: use the skittles to create a graph (yay for hands on maths!)
Step 5: students can make inferences about which group has more, which (if any) have the same, which has less.
Step 6: this could be linked to probability (If the skittles were put in a bag. how many skittles are there?
Step 6: play around with other data graph ie a pie graph.
Step 7: students could enter the data into excel and use this to create different graphs.
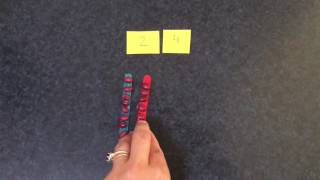
Check out this video length with short how to :)
Curriculum Links
2. ACMSP147) - creating graphs and tables
Comments